


Over their last 11 games, the San Antonio Spurs have gone 5-6. Since Volume 4 of the Spurs 10-game Evaluation, the Spurs have continued to struggle offensively while they learned during this stretch that Kawhi Leonard (return from injury management) is out indefinitely and Rudy Gay is still ‘weeks away.’ To add to the injury list, Manu Ginobili suffered a thigh injury and he’s been out for the past six games.
With 51 games logged this season, it’s time to dive deep into the stats to see how the Spurs are either declining or progressing on both sides of the ball.
Section I. Scoring
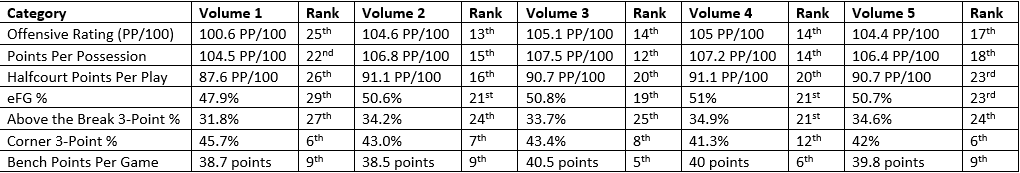
Without Leonard, the Spurs were right on the edge of being the 15th ranked offense for most of the season. Now with Gay and Ginobili out recently, you’ve seen the Spurs’ offense start to slip even more, as they’ve suffered losses in which they held their opponents to 86, 94, and 97 points.
By looking at the data above, one bright spot for San Antonio is their corner 3-point percentage, which ranks 6th in the NBA. However, the Spurs are only attempting 5.6 corner threes per game, which ranks below league average (18th) in attempts, therefore means that shot is only providing San Antonio 7.2 points on the average night.
Where do the Spurs’ points come from?
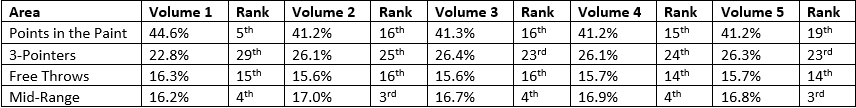
Without three of their high usage players in Leonard, Gay, and Ginobili, the Spurs are not getting a percentage of their points at a top-10 level from the paint, 3-point line, or free throw line.
After doing some research with Cleaning the Glass’ frequency of shots and accuracy stats, I was interested in seeing exactly where the Spurs’ core players shoot from most and what that accuracy percentage for their shots is so far through the season. Since this piece already has plenty of charts and tables with data, I wanted to present some of my findings in a different visual format. So, I recalled an article from Dean Oliver last season, where he introduced the concept of Threat Balance, which broke down where players are most dangerous from attacking on the court.
I used the idea to show the Spurs’ current players (aside from Leonard – too small a sample size) and where they shoot most from on the floor in terms of their position. So, here’s the visual and how to read it.
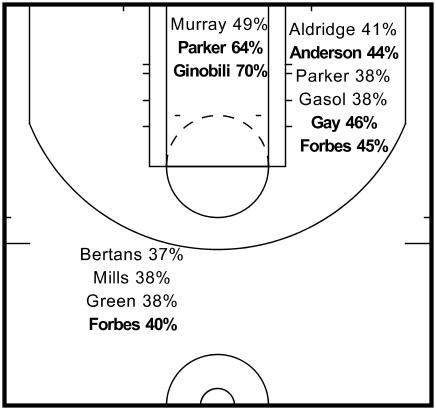
The player’s name means they are over the 70th percentile at their position in frequency of shots from that area of the floor (rim, mid-range, or three). The percentage next to their name is their field goal percentage from that specific area on the floor. If a player’s name is in bold, then that means the player’s accuracy is over the 70th percentile for their position.
By studying this visual, you can start to get a better glimpse of why the Spurs are below league average offensively. Without Leonard, they only have three players who attack the rim in the 70th or above percentile at their position. One of those players is Ginobili, who is currently injured but may return Sunday against Sacramento. While 50% of Murray’s shots come at the rim, he’s only making 49% of them, which is in the 22nd percentile among all point guards.
The next area is the mid-range. The Spurs have six players who are above the 80th percentile of getting their shots from the mid-range. This explains why the Spurs are ranked 3rd in the league in getting a percentage of their points from the mid-range. Their roster is constructed with players who mainly get a heavy bulk of their shots from the non-paint two. Of the players on the visual, only Anderson, Gay, and Forbes shoot above the 70th percentile from the mid-range at their position, and Gay may be out until the All-Star break reportedly.
Without their best player to break down a defense in Leonard, defenses aren’t allowing many shots at the rim. The Spurs also aren’t top-10 in drawing fouls and they don’t take a ton of threes, so a large portion of their offense has to come from the mid-range, where three of those six players in the visual shoot below the 70th percentile at their position.
With Aldridge being the Spurs’ primary offensive option, you can see why defenses are able to double team him more often or put more defenders near the rim. The Spurs don’t have many outside threats. Bertans, Mills, Green, and Forbes are the only four players whose frequency of shots are above the 70th percentile at their position. To go a bit further, Forbes is currently the only Spur of those four who is making 40% of his threes, which is in the 81st percentile at his position.
Using the NBA’s Usage Percentages for players, I created the chart below to show the Spurs’ 10 core players and how much of the team’s possessions they’ve been using when on the floor. I took Leonard off because there’s no timeline for his return and Gay too will still be out for a lengthy portion of time.
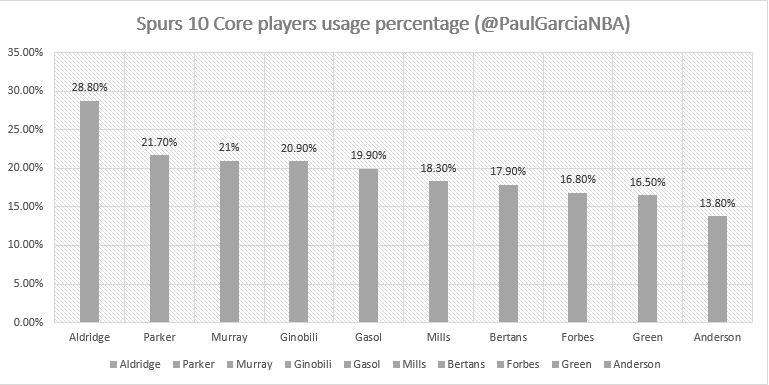
Once Ginobili returns to the lineup, he’ll help bring some playmaking back to the offense. But, the offense is still going to have difficulty scoring the ball most likely close to a league average mark because the Spurs’ first and third playmakers in Leonard and Gay are still out. It’ll continue to be a game-by-game basis of who will be the second and third playmakers alongside Aldridge each night.
Where do the Spurs rank in Offense thus far?
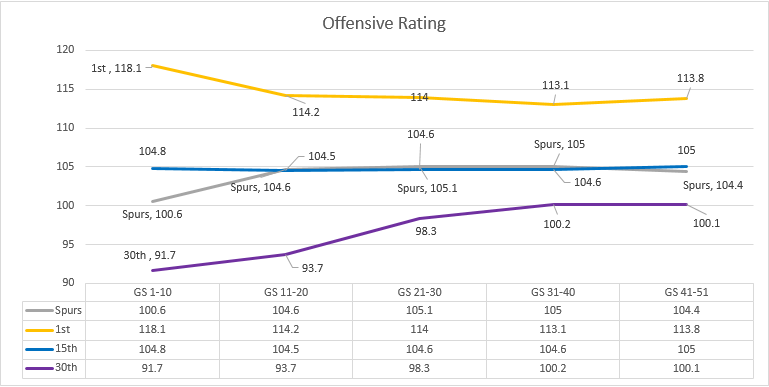
Right now, 4.3 points per 100 possessions separate the 17th ranked Spurs offense and the 30th ranked offense of the Sacramento Kings.
Section II. Ball Movement
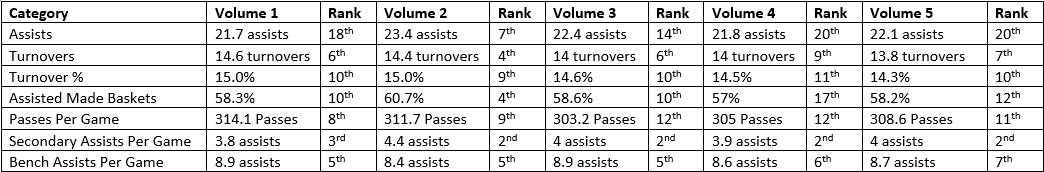
The ball movement stats continue to show the Spurs’ difficulty in making shots. As you can see by their number of passes, turnovers, and assisted made baskets, the Spurs are still moving the ball all over the floor in a careful manner, but the problem is the ball must go in the hole in order to get the assists. That’s why the assists are still so low and very uncommon for a typical Spurs offense.
Section III. Defense
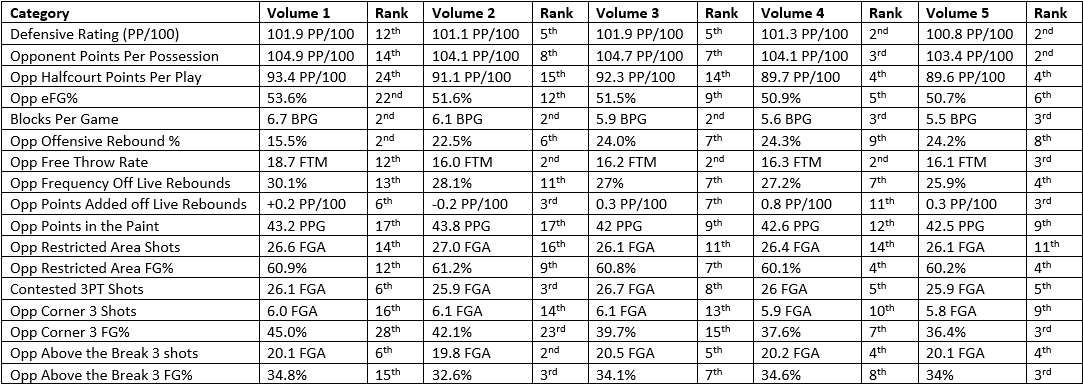
The Spurs have had Leonard available for just 18% of their games and yet they’ve won 32 games. Why, all those numbers above. The Spurs’ defense has continued to stay stellar and in some areas, like guarding the 3-point line, they’ve become even better. For all the deficiencies the Spurs’ current players have on the offensive end, when they put everything together on the other end of the floor, they’re still elite defensively.
Where do the Spurs rank in Defense thus far?
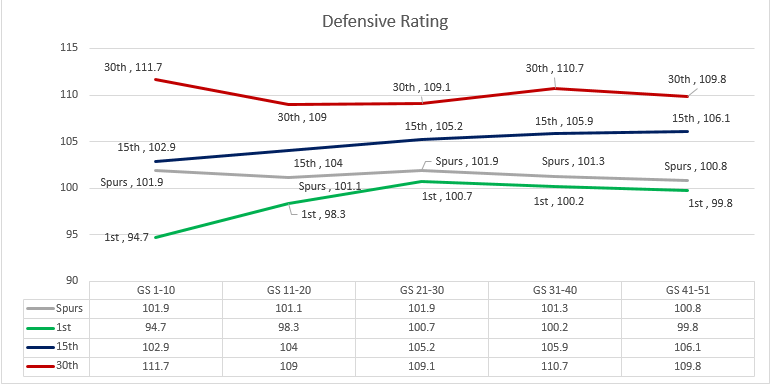
The Spurs are playing their best defensive basketball of the season, holding opponents to 100.8 PP/100. They’re now within a point per 100 possessions of the best defense in the league of Boston.
Section IV. Record Vs. Elite teams (.600 Winning Percentage)
| Category | Currently |
| Winning Percentage | 38% |
| Record | 3-5 |
The Spurs are currently 3-5 against teams with records of .600 or above.
Houston Rockets: 0-1
Golden State Warriors: 0-1
Boston Celtics: 1-1
Toronto Raptors: 1-1
Minnesota Timberwolves: 1-1
Total: 3-5
The Spurs still have seven games remaining against the teams above. Three against the Warriors, three against the Rockets, and one more matchup with the Timberwolves.
Section V. The Next 10
The Spurs’ next 10 games will take place over a 29-day span because the All-Star break will happen in between their game schedule. The Spurs have four straight home games against the Kings, Nuggets, Rockets, and Jazz, then they’ll set out on their six game Rodeo Road trip against the Suns, Warriors, Jazz, Nuggets (twice), and Cavaliers.
Data gathered from NBA.com/stats as of 01/27/2018 at 1:30 PM CST. Bench stats collected from HoopsStats.com after 51 games for San Antonio. Player Tracking stats collected after 51 games. Other stats collected from CleaningtheGlass.com as of 1:30 PM CST.


